
Implemention and use of Logitan are very easy! Anyone can start Logitan easily and smoothly.


Data aggregation and analysis are easy.
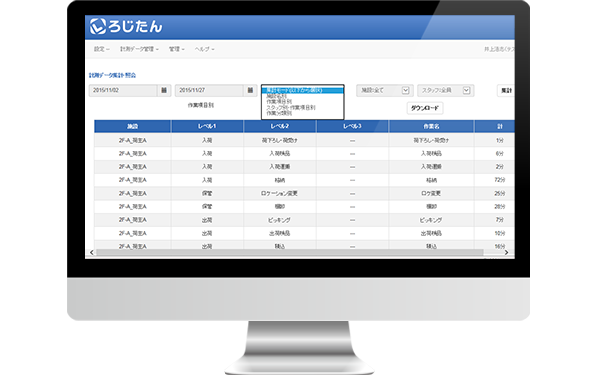
Easy data aggregation (Logitan Web) Easy to make graphs and tables (Analysis Tools)Easy data aggregation (Logitan Web)
Aggregation is easily processed for browsing by choosing facility, work item, staff or work category (main, supplementary or non-performing).

Aggregated working hours will be displayed if you choose auto aggregation from “aggregation type”. This is a very useful tool as a simple indicator for checking daily operations.
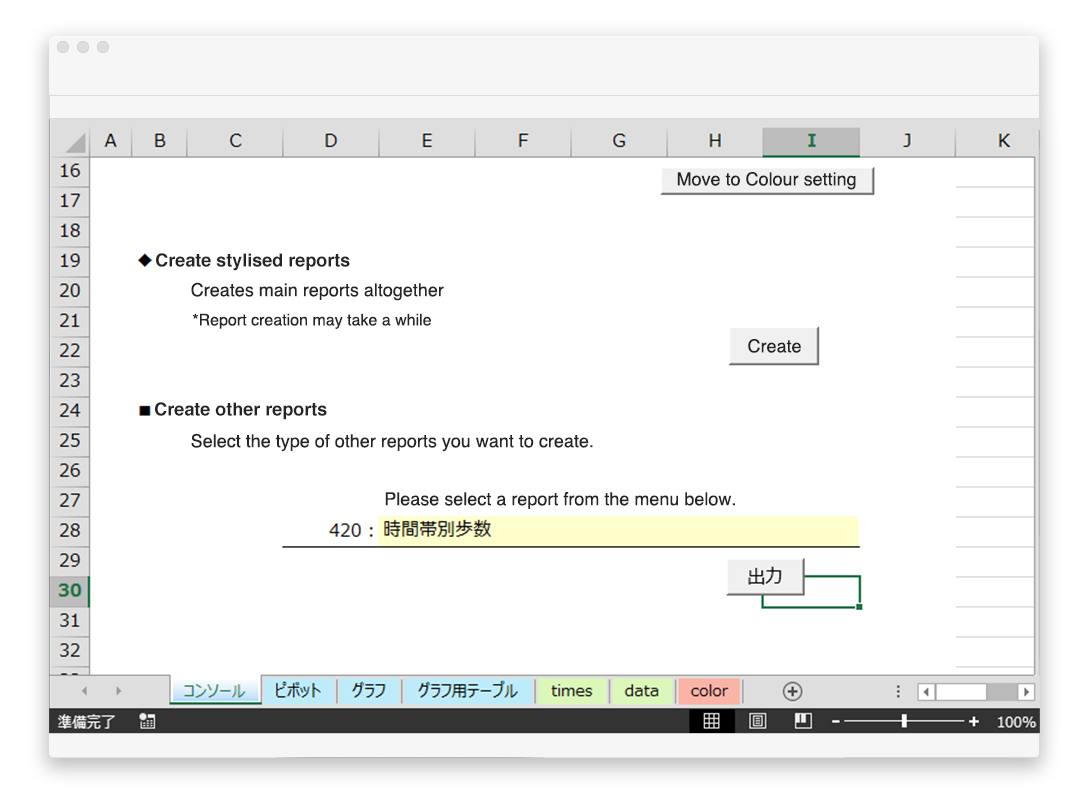
Easy to make graphs and tables (Analysis Tools)
Stylised graphs can be automatically created by importing CSV data (downloaded from the web) into Logitan EXCEL tool.

Clicking on a button on excel analysis tool produces graphs and tables such as “time table per staff”, “work ratio per time slot” and “step counts per staff by work”. Looking at the results from various angles will be helpful for your improvement activities.